


Step 1: View Your Analytics
So how do you access your quiz’s analytics? Simply log into Interact and, from your Dashboard, select “Analytics” in the right-hand corner:

From there, you’ll be redirected to your analytics Overview, where you can see your quiz’s Top Results:
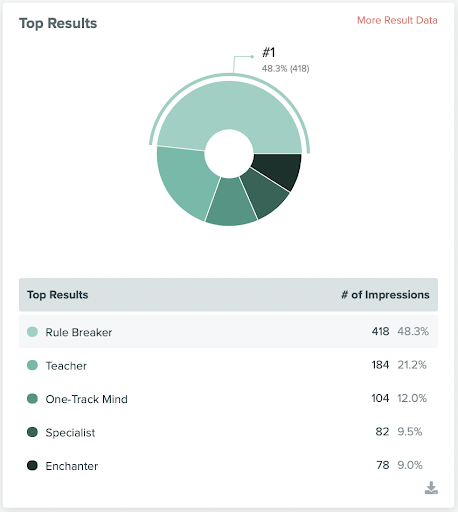
As you can see in the above screenshot from Chanti Zak’s Unfair Advantage Quiz, the majority of quiz takers are “Rule Breakers.” With this information, Chanti can begin creating or optimizing her existing marketing materials to reflect the needs of individuals with that personality type, and, thereby, build relationships with more of her ideal clients.
You’ll also see your quiz’s Total Events, meaning the number of times the quiz has been viewed:
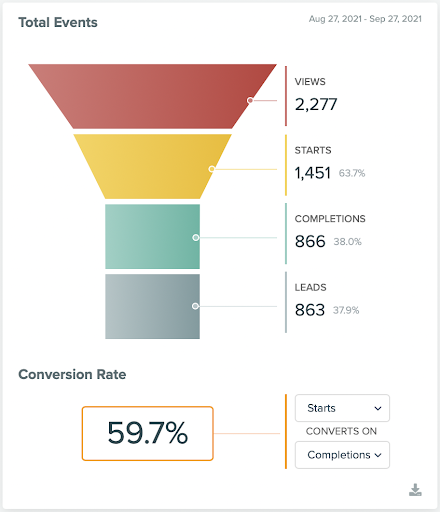
With this information, you can find things that need improvement — for example, if you're getting a lot of “views” but not many “starts,” then you can assume that the quiz is appearing properly on your website, but maybe the title and subtitle need to be refined and made a bit more enticing.
And if people are completing the quiz but not leaving their emails, try changing up the copy on the opt-in form or making it required and see what happens. Make sure to give them a real reason to submit their information and see their results.
If your quiz takers are exiting between “starts” to “completions”, then it’s probably time to take a look at your question analytics to see exactly where you're losing them.
Step 2: Optimize Your Questions
To view your questions analytics, select “Questions & Answers” from the menu at the top of the page:

You’ll see feedback on all of your questions, including how many times it’s been viewed, answered, and its overall engagement rate:
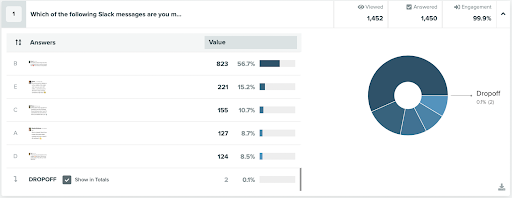
Pay special attention to the dropoff rate in the bottom left-hand corner; this is the percent of people who have exited your quiz from that question. As you can see, the dropoff rate on this question is only 0.1% — it doesn’t get much better than that!
But if it’s sitting at a higher rate, you’ll want to refine that question and either make it more engaging or change the order of your quiz’s questions. Keep in mind that depending on your audience size, these are small numbers and consider how long you've had the quiz published and how many views you've had before making any major changes.
Step 3: Keep Refining
Once you’ve gone through your quiz’s analytics and made a few tweaks, give yourself a week or two then check-back to see how they have impacted your conversion rate.
Remember, this is an ongoing process, and you’ll get the most out of your quiz by staying consistent and making changes as needed.
Step 4: Cater Your Business To Your Customers’ and Clients’ Needs
After at least a few dozen people have taken your quiz, you’ll be able to see trends in how people are answering your questions and which results they get. From there, you can curate your content and offers to what your people really need!

Action Steps
-
Get your quiz out there into the world and give it time. Don’t change anything until you have enough data to make informed decisions.
-
Navigate to your quiz’s analytics and review its Top Results, Total Events, and Questions & Answers.
Start by checking out your Views to Starts. If that number is under 50%, consider working a bit harder on your landing page copy, quiz title, and quiz description.
-
Next, check your Starts to Completions. If that number is under 50%, move on to your question analytics and make sure that your drop off rate is less than 10%. If it’s higher than that, check the question for clarity and make sure that it’s not too invasive or hard to answer.
-
Finally, check out your Completions to Leads. If this number is below 50%, consider optimizing your Opt-In copy by referring back to the benefit they’ll receive by joining your email list.